Your endpoint takes 1.2 seconds to respond. Users are noticing. Your PM is asking questions. You open the code, stare at it for a while, and think "this should be fast."
The code looks fine. It fetches some data, makes an API call, transforms the result, sends it back. None of those steps seem expensive on their own. But something in that chain is eating over a second, and you have no idea which part.
So you do what every developer does. You start sprinkling console.log(Date.now()) before and after every operation, restart the server, hit the endpoint, scroll through the terminal, do the subtraction in your head, and try to piece together where the time went.
This is debugging by guessing. It works eventually. But it's slow, tedious, and you end up ripping out 15 console.log statements when you're done.
There's a better way.
A slow API endpoint is almost always caused by one of three things: database queries taking too long, outbound HTTP calls to third-party APIs or microservices being slow, or your own application code doing too much work. The hard part isn't knowing these categories exist. The hard part is figuring out which one is responsible for your specific endpoint.
Most slow endpoints aren't slow because of one obviously broken thing. They're slow because of a pile of things that each look fine on their own:
- 8 database queries that each take 15ms = 120ms of DB time you didn't notice
- A Stripe API call that takes 400ms on a good day and 900ms on a bad day
- JSON serialization of a response with 50 nested objects taking 80ms
- An N+1 query pattern that fires 20 queries when your test data only had 3 rows
The endpoint returns 200 OK. The data is correct. Nothing is "broken." But the response takes 1.2 seconds and your users can feel it.
Every API request spends its time in three buckets: database queries, outbound fetches, and application code. The total response time is roughly the sum of these three, depending on whether operations run in sequence or in parallel.
Here's what a typical slow endpoint looks like when you actually break it down:
POST /api/checkout - 1,240ms total

  DB queries:      340ms (8 queries, ~42ms each)
  Outbound fetch:  620ms (Stripe charge API)
  App code:        280ms (validation + serialization)
The slowest part here is the Stripe call at 620ms. You can't make Stripe faster. But the 340ms of DB time is 8 individual queries that could be batched into 1 or 2. And 280ms of app code is suspicious for what should be simple validation.
Without this breakdown, you'd be guessing. Maybe you'd optimize the database queries first, shave off 200ms, and still have an 800ms endpoint because the real bottleneck was the third-party call the whole time.
The most common approach is manual timing with Date.now() or performance.now(), wrapping each section of your code to measure how long it takes.
app.post('/api/checkout', async (req, res) => {
  const t0 = performance.now();

  const cart = await getCart(req.body.cartId);
  console.log('getCart:', performance.now() - t0, 'ms');

  const t1 = performance.now();
  await validateStock(cart);
  console.log('validateStock:', performance.now() - t1, 'ms');

  const t2 = performance.now();
  const charge = await stripe.charges.create({ ... });
  console.log('stripe:', performance.now() - t2, 'ms');

  const t3 = performance.now();
  const order = await createOrder(cart, charge);
  console.log('createOrder:', performance.now() - t3, 'ms');

  console.log('total:', performance.now() - t0, 'ms');
  res.json(order);
});
This works. You run the endpoint, look at the output, and see something like:
getCart: 45ms
validateStock: 312ms
stripe: 623ms
createOrder: 89ms
total: 1071ms
Now you know validateStock is suspiciously slow and Stripe takes 623ms. Progress.
But this approach has real problems:
You're measuring the wrong thing. validateStock took 312ms, but was that 312ms of database queries? Or 312ms of CPU work? You can't tell without adding more timing inside that function. And inside that function's dependencies. You end up with timing code 3 layers deep.
You have to know where to look. You're only measuring the sections you thought to wrap. If the bottleneck is buried in a utility function you didn't instrument, you'll miss it entirely.
It's not per-request. When you remove the console.logs, the measurements are gone. Next time the endpoint is slow, you start over from scratch.
It doesn't aggregate. One request might have a slow Stripe call. Another might have slow queries. You need to see the pattern across multiple requests, not just one.
Slow database queries in API endpoints usually come from three patterns: too many queries per request, missing indexes, or queries that return too much data. The first one is by far the most common.
This is the N+1 problem. Your endpoint runs 1 query to load a list, then N more queries to load related data for each item. With 50 items, that's 51 round trips to the database instead of 1 or 2.
Each round trip carries overhead beyond just the SQL execution time. Connection pool checkout, network latency, result deserialization. 50 queries at 5ms each is 250ms of pure I/O that a single WHERE id IN (...) query would handle in 10ms.
The tricky part is that each individual query is fast. Your query logs show nothing slow. But the cumulative time adds up quietly.
A query that scans the entire table instead of hitting an index can jump from 2ms to 200ms as your dataset grows. This usually shows up as one or two queries that are individually slow rather than many fast queries adding up.
Check for queries that filter on columns without indexes. In Prisma, this often means adding @@index to your schema.
Queries that return 100+ rows when the endpoint only needs 10, or SELECT * when you only need 3 columns. The database does the work, serializes the result, sends it over the wire, and your ORM hydrates objects you'll never touch.
Outbound HTTP calls to third-party services or internal microservices are often the single biggest contributor to endpoint latency. Unlike database queries, you usually can't optimize the remote service itself.
Common causes:
The service is just slow. Payment processors, email APIs, and AI inference endpoints can take 200ms to 2 seconds. If your endpoint waits for the response synchronously, that's your floor. There's nothing to optimize.
Sequential calls that could be parallel. If your endpoint calls Service A, waits for the response, then calls Service B, and the calls don't depend on each other, you're paying for both wait times in full:
// Sequential: 400ms + 300ms = 700ms total
const user = await fetchUserService(userId);
const prefs = await fetchPreferencesService(userId);

// Parallel: max(400ms, 300ms) = 400ms total
const [user, prefs] = await Promise.all([
  fetchUserService(userId),
  fetchPreferencesService(userId),
]);
If two calls have no dependency on each other, they should never run one after the other. Promise.all cuts the combined wait to whichever call is slowest.
DNS resolution and TLS handshake. The first request to a new host pays for DNS lookup + TCP + TLS setup. Subsequent requests on the same connection skip all of that. If your app creates a new connection per request instead of reusing them, you're paying this cost every single time.
Retries and timeouts. If a service is flaky and your HTTP client retries on failure, a single "call" might actually be 2 or 3 attempts with backoff delays between them.
Application code is everything that isn't waiting on a database or a network call. It's the computation your server does between I/O operations. In most APIs, this should be the smallest portion of response time. When it's not, something unusual is going on.
Common causes:
Heavy serialization. Transforming a large nested object into JSON can take 50-200ms if the response contains thousands of records or deeply nested relationships. Especially if you're running .map() transformations on each item before sending.
Synchronous encryption or hashing. bcrypt.hashSync() blocks the event loop. A single call can take 100-500ms depending on the cost factor. If this happens inside a request handler, every other request sits and waits.
Middleware overhead. Authentication middleware that validates a JWT, looks up the user in the database, and attaches permissions to the request. This runs on every single request. If that lookup takes 40ms, every endpoint in your app starts 40ms behind before it does any real work.
Memory pressure. If your process is running close to its memory limit, the garbage collector kicks in more often and pauses execution. This shows up as inconsistent response times that spike randomly.
The answer is per-request time breakdown. Instead of manually timing code sections, you want a tool that automatically captures every database query, every outbound fetch, and every millisecond of app code for each request, then shows you where the time went.
Brakit does exactly this. It hooks into your application at the runtime level and captures every query, every fetch, and every error for each HTTP request. The performance tab gives you three numbers for every endpoint: DB time, Fetch time, and App time.
Instead of adding console.log timing, you see this for every request:
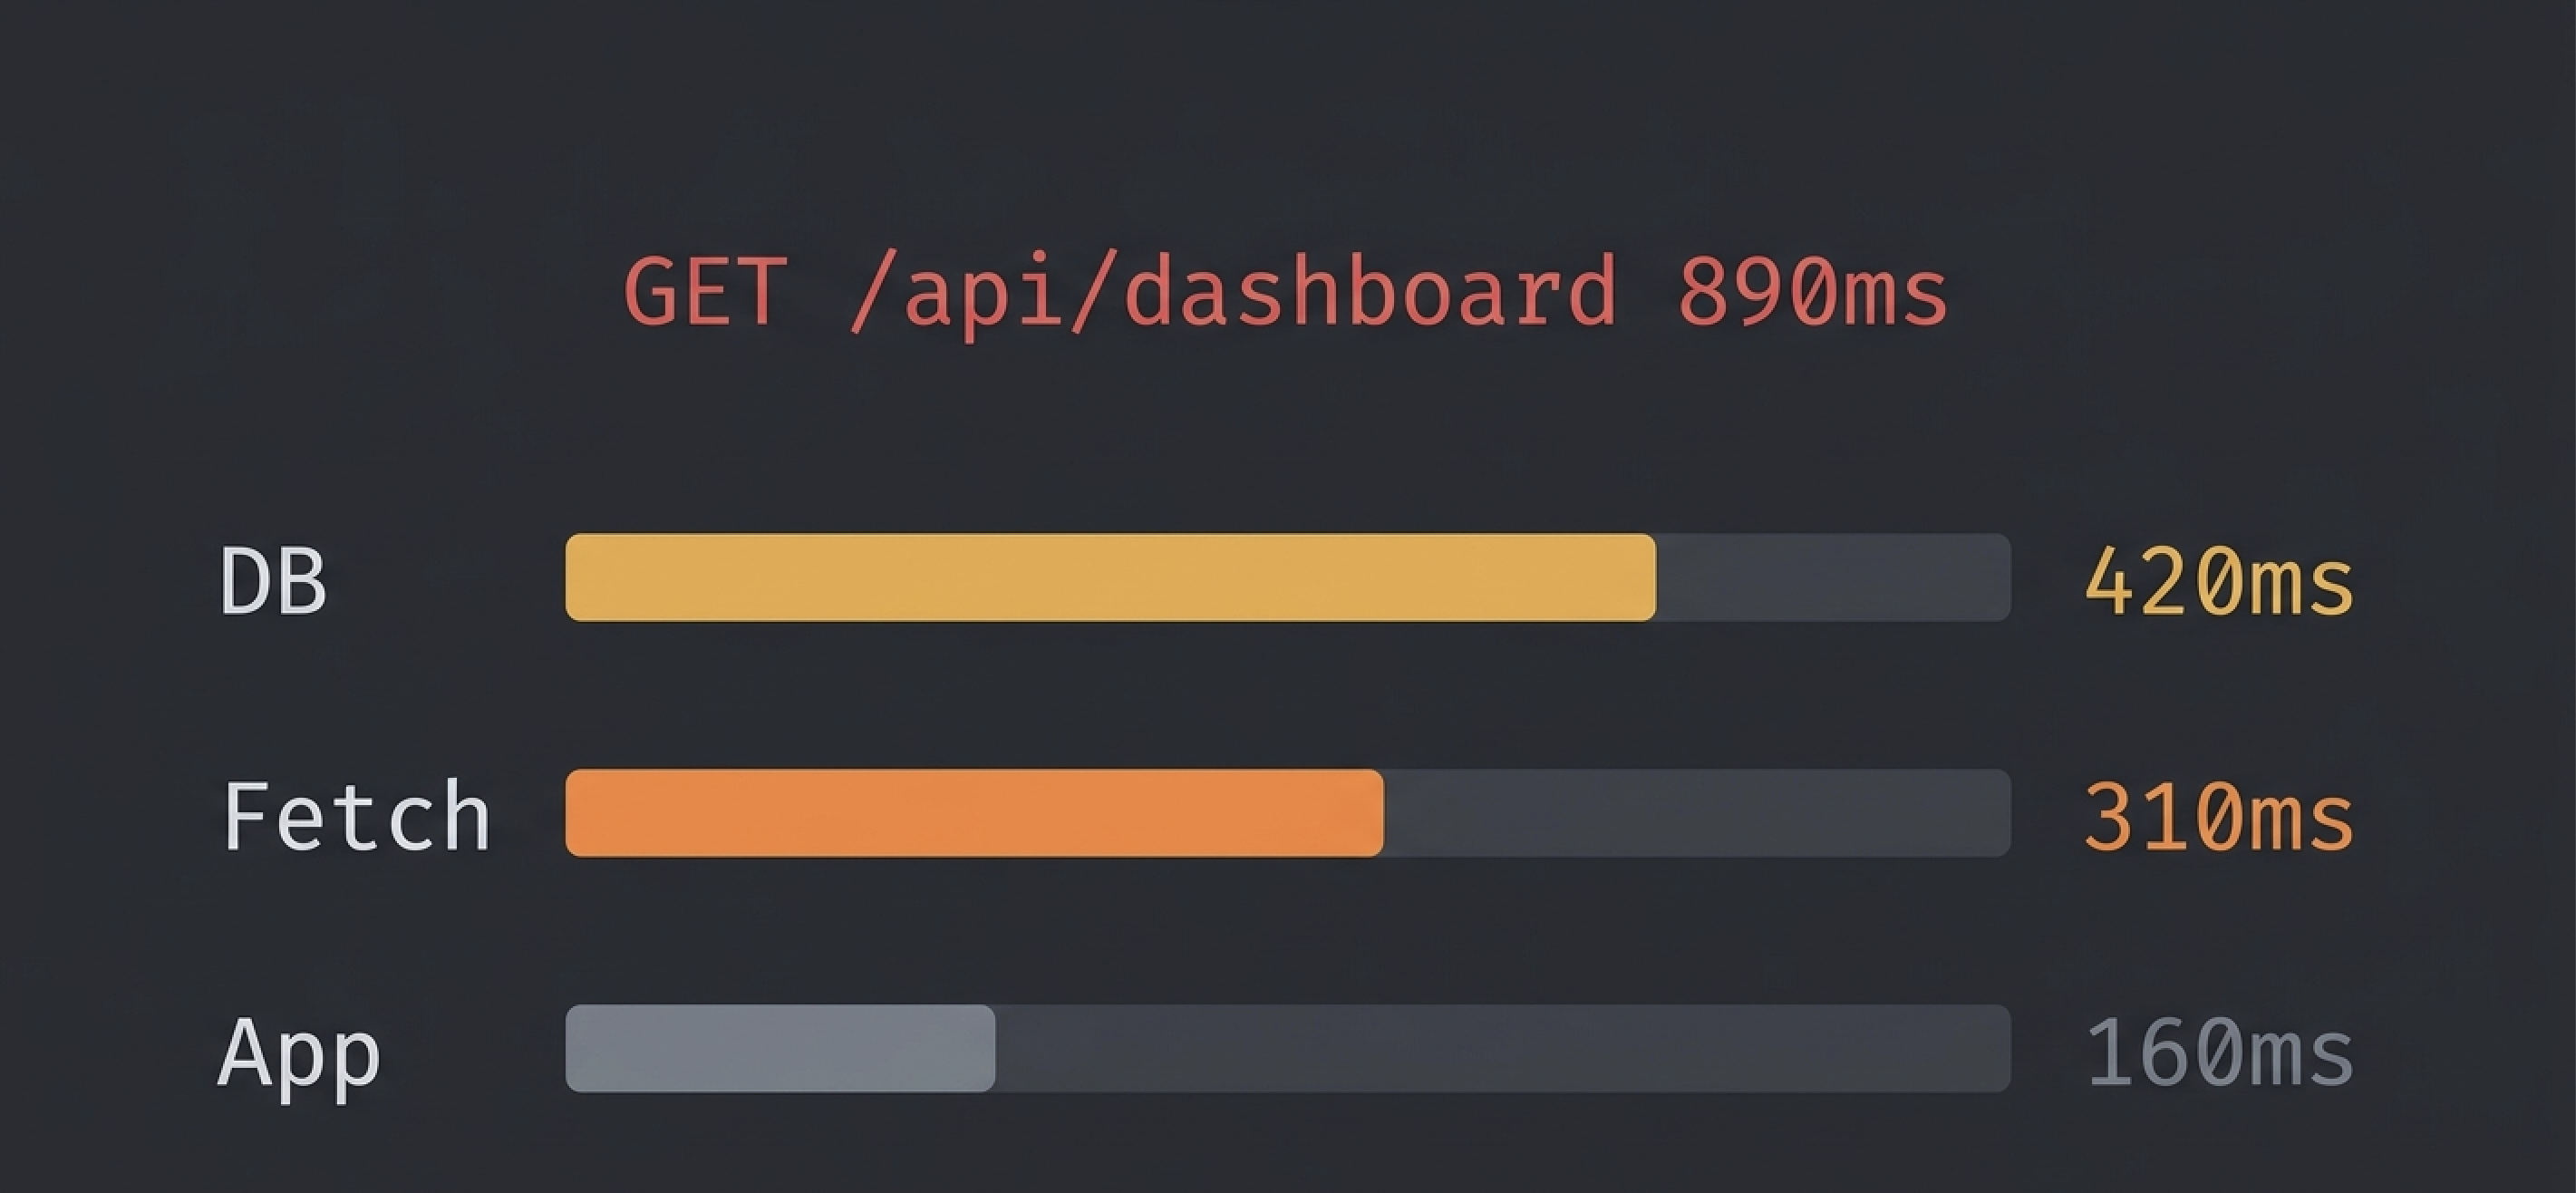
GET /api/dashboard - 890ms
  DB:    420ms  (12 queries)
  Fetch: 310ms  (2 calls)
  App:   160ms
You immediately know: 420ms is DB time from 12 queries (probably an N+1), 310ms is two outbound calls, and 160ms is your own code. No guessing. No manual instrumentation.
Brakit also tracks your endpoint's P95 latency across dev sessions. If your endpoint was 200ms yesterday and is 800ms today, it flags the regression automatically. You don't find out by accident three weeks later.
The setup takes one command:
npx brakit install
npm run dev
Open /__brakit in your browser. Every endpoint's time breakdown is right there.
Brakit also exposes its findings through MCP, so if you use Claude or Cursor, your AI assistant can see the performance breakdown directly and suggest fixes without you copying data back and forth.
Once you know where the time is going, the fixes are straightforward. Work on the biggest bucket first.
- Check for N+1 queries. If you see 10+ queries of the same shape, batch them with
WHERE IN or use eager loading (include in Prisma).
- Add indexes. If one query is individually slow, check for missing indexes on the filtered columns.
- Reduce overfetching. Select only the columns you need. Add
LIMIT if you're loading more rows than necessary.
- Cache repeated queries. If the same data is fetched on every request and changes rarely, cache it in memory or Redis.
- Parallelize independent calls. Use
Promise.all() for calls that don't depend on each other.
- Add timeouts. A third-party service that hangs for 30 seconds will make your endpoint hang for 30 seconds. Set a reasonable timeout (3-5s) and handle the failure gracefully.
- Move slow calls out of the request path. If you're sending an email or updating analytics on every request, push it to a background queue. The user doesn't need to wait for that.
- Cache external responses. If a service returns the same data for hours, cache it locally.
- Profile the code. Use Node.js's built-in profiler or
--inspect to find CPU hotspots.
- Avoid blocking operations. Replace
bcrypt.hashSync with bcrypt.hash. Replace fs.readFileSync with fs.readFile.
- Paginate large responses. If you're serializing 10,000 objects, add pagination so each request handles a smaller set.
- Move heavy computation off the request thread. Use worker threads or a background job for expensive operations.
Yes. An endpoint that performs well locally can be dramatically slower in production because the conditions that make endpoints slow don't exist on your machine. Large datasets, concurrent load, congested connection pools, real external API latency. None of that shows up when you're the only user hitting localhost.
The gap shows up in a few specific ways:
Data volume. Your dev database has 3 projects. Production has 150. An N+1 that fires 4 queries locally fires 151 in production. The endpoint that took 20ms now takes 900ms.
Concurrent load. Locally you're the only user. In production, 50 users hit the dashboard at the same time. Each request competes for connection pool slots. A request that normally takes 100ms now waits 400ms just to get a database connection.
External API behavior. Third-party APIs have rate limits and variable latency. GitHub, Stripe, SendGrid. They all behave differently under real traffic than in local development where you're making a handful of test requests.
Missing indexes. A query that full-scans 1,000 rows in dev full-scans 500,000 rows in production. The query is the same. The cost is not.
This is the hardest part of API performance work. The feedback loop is slow. You write code locally, it looks fine in testing, and you don't see the real performance profile until it's already affecting users. The only way to close that gap is to measure in development with production-like instrumentation. Count actual queries. Time actual calls. Flag patterns before they hit real data.
The hardest part of performance work isn't fixing the problem. It's noticing the regression before users do.
Endpoints get slower gradually. A new query here, a new middleware there. Each change adds 20ms. After a few months, a 100ms endpoint is 400ms and nobody remembers when it changed.
Track your baselines. Brakit stores P95 latency for every endpoint across dev sessions. If your endpoint's P95 jumps from 150ms to 600ms between sessions, it flags the regression and shows you the query count changed too. You catch it in development instead of in production.
Watch your query count. If an endpoint's queries-per-request goes from 4 to 12, something changed. Even if the total time is still acceptable, the trend matters.
Test with realistic data. The endpoint that takes 50ms with 3 test rows will take 500ms with 3,000 production rows. Seed your dev database with enough data to expose scaling problems before they do.
Enable query logging in your ORM or database driver, then look at duration per query. In Prisma, use prisma.$on('query') to log each query and its duration. The query that takes the longest individually is worth investigating for missing indexes. If all queries are fast but there are many of them, you have an N+1 pattern. Brakit surfaces both automatically by grouping queries by the request that triggered them.
Under 200ms is fast. 200-500ms is acceptable for most applications. Over 1 second is noticeable to users. Over 3 seconds and users start abandoning. These numbers vary by use case, but if your endpoint is consistently above 500ms, it's worth looking into.
APM tools like Datadog, New Relic, and Sentry are built for production monitoring. They're great at alerting you when something is already slow in production. But they don't help during development, they require production-level infrastructure to set up, and their query-level detail is often limited. Brakit runs locally during development and shows you per-request query breakdowns before you ever ship.
Yes. If your endpoint makes a synchronous call to a third-party service and waits for the response, your endpoint can never be faster than that service. If Stripe takes 600ms, your endpoint takes at least 600ms. The fix is to parallelize the call with other work, cache the result if appropriate, or move the call to a background job so the user doesn't wait for it.
There's no universal number, but more than 10 queries for a single endpoint is a sign something could be batched or preloaded. Brakit flags endpoints that fire the same query shape 5 or more times per request, which is the threshold for an N+1 pattern.
Not always. Some operations are genuinely CPU-intensive. Image processing, cryptographic operations, large data transformations. The question is whether that work needs to happen in the request path. If it does, optimize it. If it doesn't, move it to a background job so the user doesn't wait for it.
If you want to know exactly where your endpoint's time is going, without adding timing code everywhere, try Brakit. One command to install. Every request shows you DB time, fetch time, and app time. Open source, runs locally, and your data never leaves your machine.
Get started in 2 minutes → · View on GitHub →